
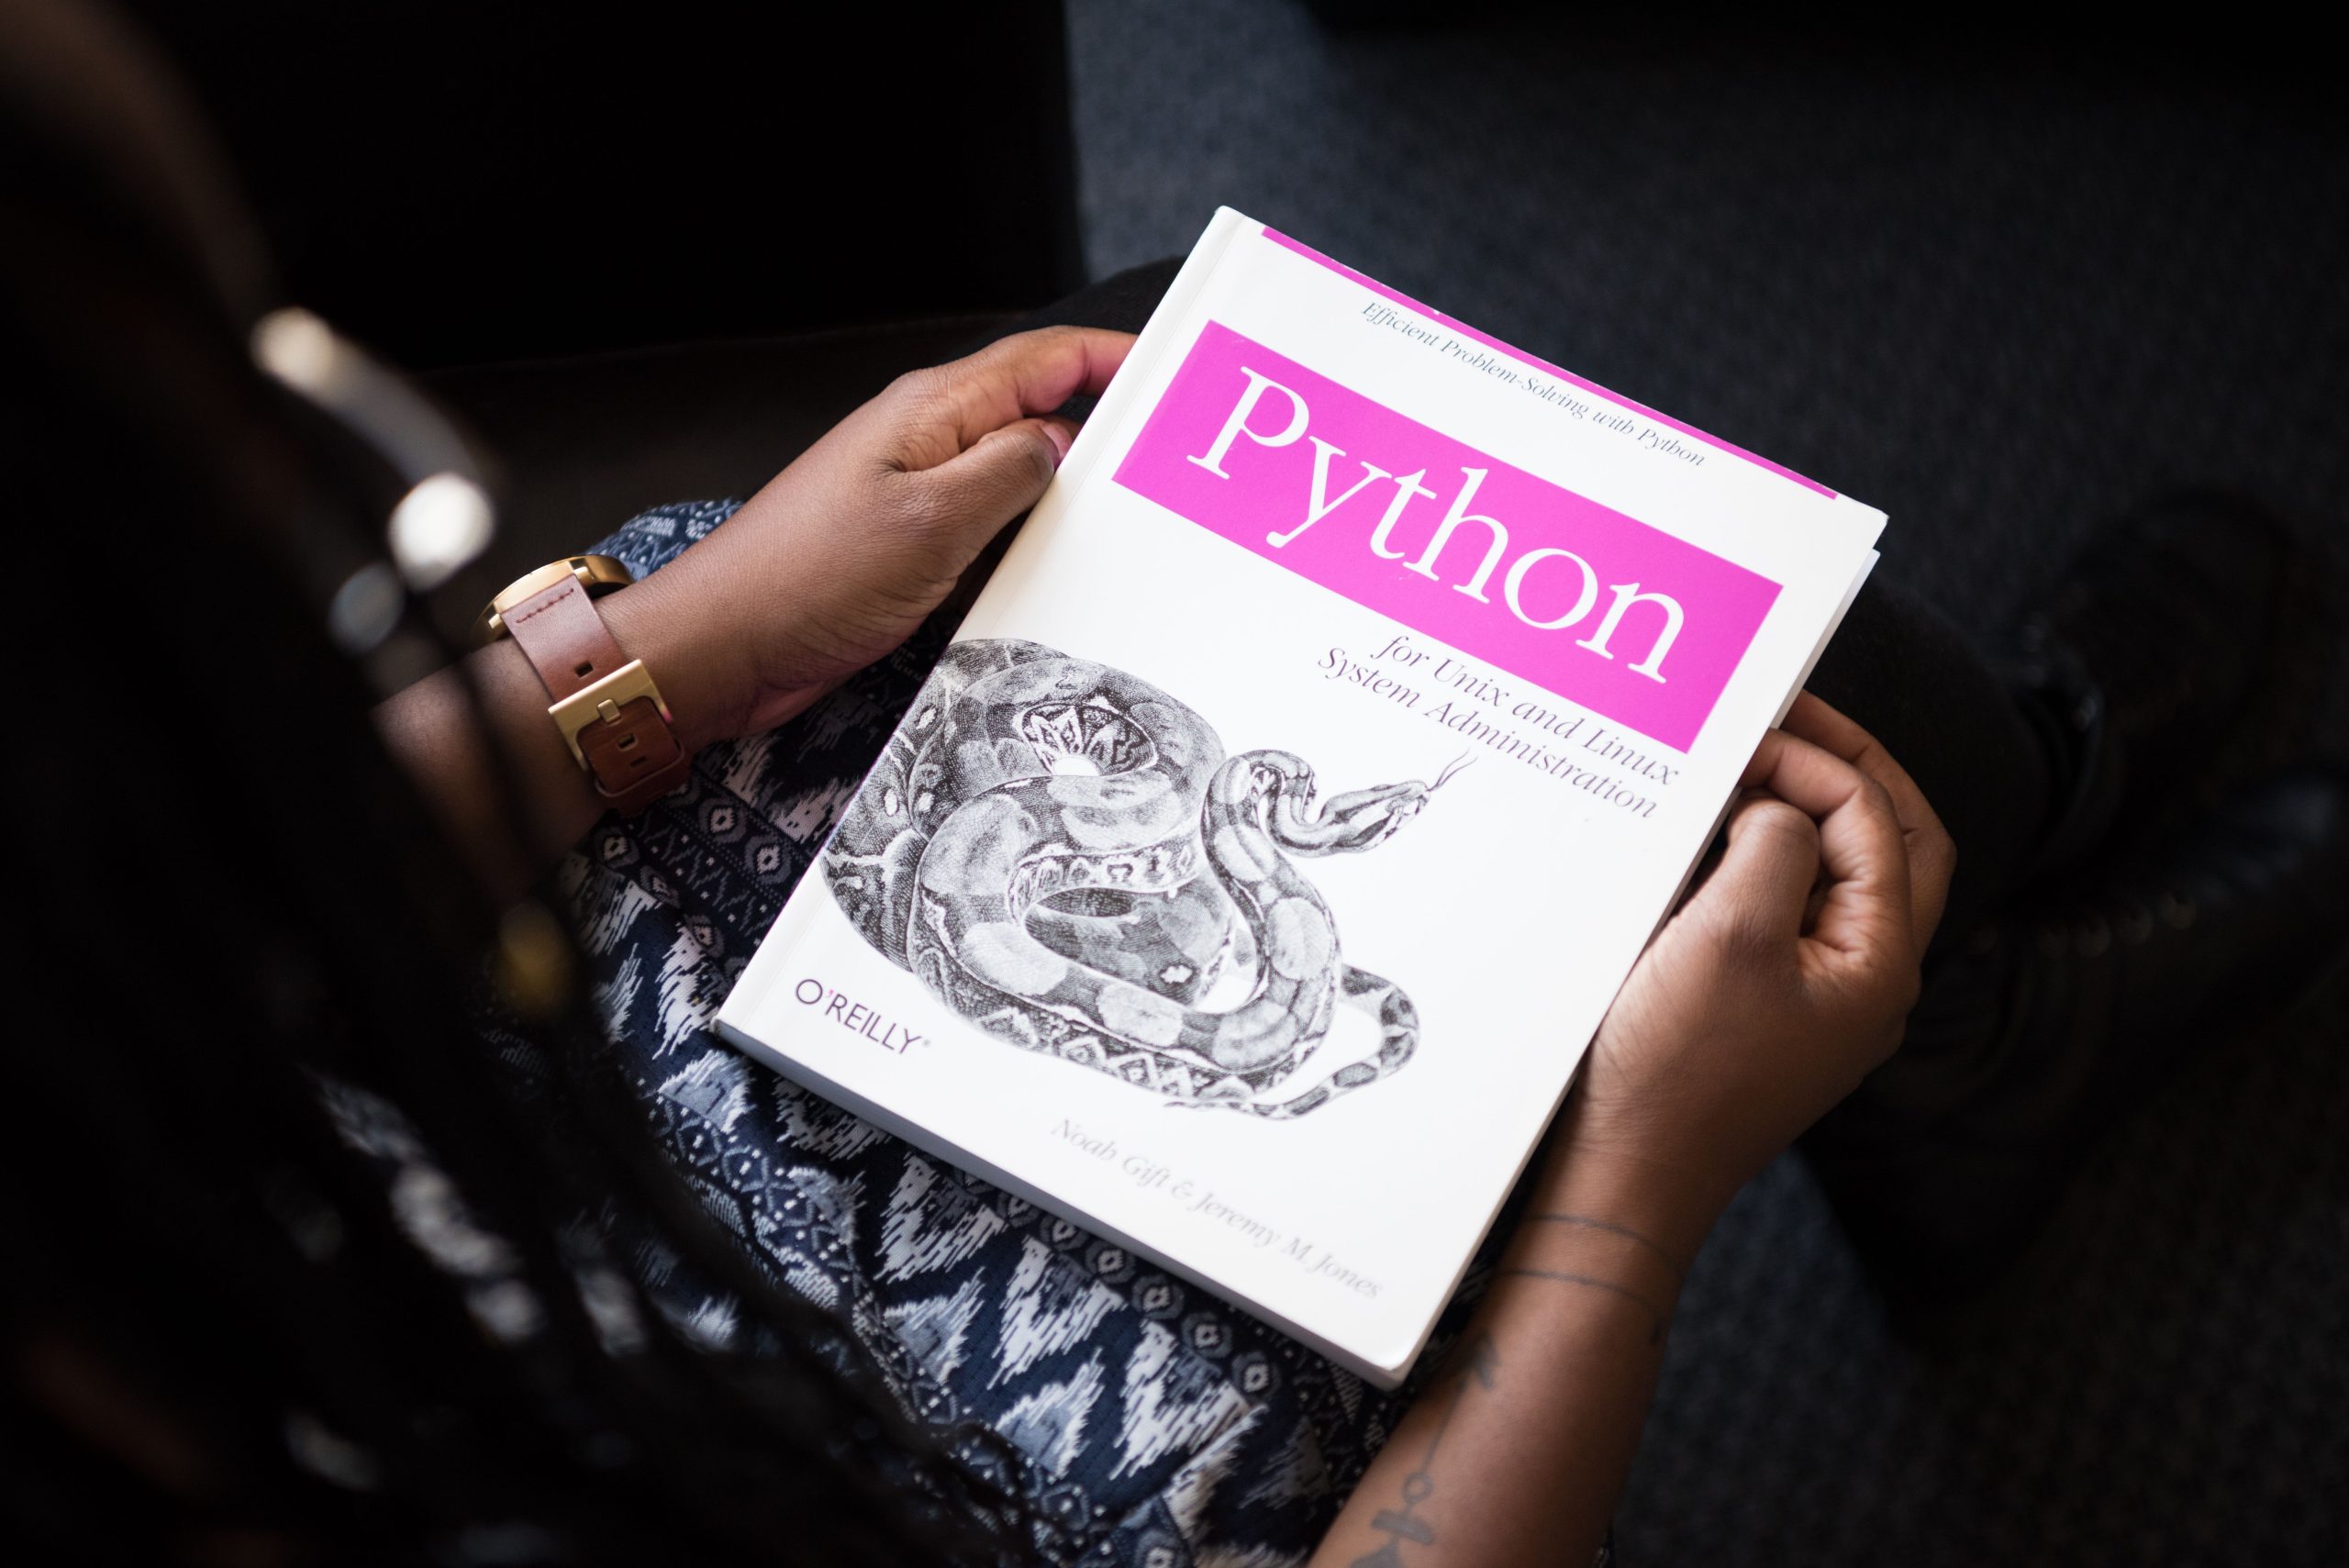
Are you an aspiring data analyst looking to elevate your skills in Python? With the vast array of libraries available, it can be overwhelming to find the right tools to get started. This article highlights the top 10 Python data science libraries that can empower you to analyze data, create visuals, and generate insights effectively.
From data manipulation to machine learning, each library serves a unique purpose and comes with its own set of features. Dive in to discover the essentials that can transform you into a proficient data analyst!
1. Pandas – Best For Data Manipulation
Pandas is the go-to library for data manipulation and analysis in Python. It provides data structures like Series and DataFrame that allow users to handle and analyze large datasets seamlessly.
Key Features:
- DataFrame and Series for easy data handling
- Powerful data cleaning and transformation capabilities
- Integration with many data formats (CSV, Excel, SQL)
Pros:
- Intuitive and user-friendly
- Excellent community support and documentation
- Highly optimized for performance
Cons:
- Can consume a lot of memory with large datasets
- Steeper learning curve for complex operations
2. NumPy – Best For Numerical Data Operations
NumPy is essential for numerical computing in Python. It provides support for arrays and matrices, along with a collection of mathematical functions for performing operations on these data structures.
Key Features:
- Multi-dimensional arrays for efficient data handling
- Comprehensive mathematical library
- Integration with other libraries like pandas and matplotlib
Pros:
- High performance for large data sets
- Widely used in scientific computing and machine learning
- Strong community and extensive documentation
Cons:
- Initial setup can be complex for some users
- Less user-friendly for beginners compared to higher-level libraries
3. Matplotlib – Best For Data Visualization
Matplotlib is a must-have library for creating static, animated, and interactive visualizations in Python. It allows users to generate a wide range of plots and charts for data analysis.
Key Features:
- High-quality 2D and 3D plots
- Customization options for styles and colors
- Compatibility with pandas and NumPy
Pros:
- Highly customizable visualizations
- Widely used in the data science community
- Comprehensive documentation available
Cons:
- Can be complex for beginners to get started
- Limited interactivity compared to other libraries
4. Seaborn – Best For Statistical Data Visualization
Seaborn is built on top of Matplotlib and offers a high-level interface for drawing attractive statistical graphics. It simplifies complex visualizations and provides more aesthetically pleasing default styles.
Key Features:
- Built-in themes for attractive visualizations
- Works efficiently with pandas DataFrames
- Supports complex visualizations like heatmaps and violin plots
Pros:
- User-friendly for beginners
- Great for exploring data relationships
- Easily integrates with Matplotlib for advanced customization
Cons:
- Limited control over plot types and styles
- Can be slower with large datasets
5. Scikit-learn – Best For Machine Learning
Scikit-learn is a powerful library for implementing machine learning algorithms. It offers a range of supervised and unsupervised learning techniques, making it easy for analysts to build predictive models.
Key Features:
- Wide array of algorithms and tools
- Efficient model training and evaluation functions
- Easy integration with NumPy and pandas
Pros:
- User-friendly API
- Strong community and continual updates
- Comprehensive documentation and tutorials
Cons:
- Can be limited for deep learning tasks
- Requires a foundational understanding of machine learning concepts
6. Statsmodels – Best For Statistical Modeling
Statsmodels is dedicated to statistical modeling. It allows data analysts to explore data, estimate statistical models, and perform hypothesis testing with ease.
Key Features:
- Wide range of statistical tests and models
- Integration with pandas for data handling
- Comprehensive model output and summary functions
Pros:
- Great for econometrics and statistical analysis
- Intuitive interface for beginners
- Strong emphasis on statistical theory
Cons:
- Not as user-friendly for advanced users
- Limited visualizations compared to other libraries
7. TensorFlow – Best For Deep Learning
TensorFlow is an open-source library for deep learning. It provides a robust platform for building and training machine learning models, particularly neural networks, with flexible tools and libraries.
Key Features:
- Support for distributed computing
- Extensive APIs for building complex models
- Integration with Keras for simplified neural network construction
Pros:
- Highly scalable for large datasets
- Strong community support and resources available
- Broad range of applications, from research to production
Cons:
- Steep learning curve for beginners
- Advanced capabilities can be overwhelming
8. Keras – Best For Rapid Prototyping
Keras provides an easy-to-use interface for building and training neural networks. It’s designed for quick experimentation, making it ideal for beginners and seasoned practitioners alike.
Key Features:
- High-level API for building deep learning models
- Flexible and modular architecture
- Support for multiple backends, including TensorFlow
Pros:
- Easy to learn and use
- Great for quick prototyping and testing
- Extensive community and documentation
Cons:
- Less flexibility compared to lower-level libraries
- Performance overhead due to high-level abstraction
9. Plotly – Best For Interactive Visualizations
Plotly is perfect for creating interactive graphs and dashboards. It allows data analysts to visualize information in a more user-engaging manner with a variety of interactive chart types.
Key Features:
- Support for a wide range of chart types
- Dash framework for building web applications
- Export options for sharing visualizations
Pros:
- User-friendly interface for interactivity
- Integration with Jupyter notebooks and other tools
- Good for presentations and sharing insights
Cons:
- Can be slower than static libraries for large datasets
- Less control over customization compared to Matplotlib
10. Scrapy – Best For Data Scraping
Scrapy is an open-source web-crawling framework for Python. It is tailored for data extraction from websites, making it an essential tool for data analysts who need to gather data for analysis.
Key Features:
- User-friendly framework for web scraping
- Built-in support for handling requests and storing data
- Robust tools for managing spiders and scrapers
Pros:
- Eliminates the need for manual data collection
- Highly customizable for specific scraping tasks
- Strong community and enhanced support available
Cons:
- Requires knowledge of HTML and CSS for effective scraping
- Can be complex for large scale projects
How to Choose the Right Python Data Science Library
When selecting a Python library for data science, consider the specific tasks you need to accomplish. Assess whether you need tools for data manipulation, visualization, statistical analysis, or machine learning. Think about your level of expertise and how quickly you need to start making insights from your data. Each library has its strengths, and often, using a combination of them yields the best results.
#DataScience #Python #DataAnalysis #MachineLearning #Programming #DataVisualization #TechTools