
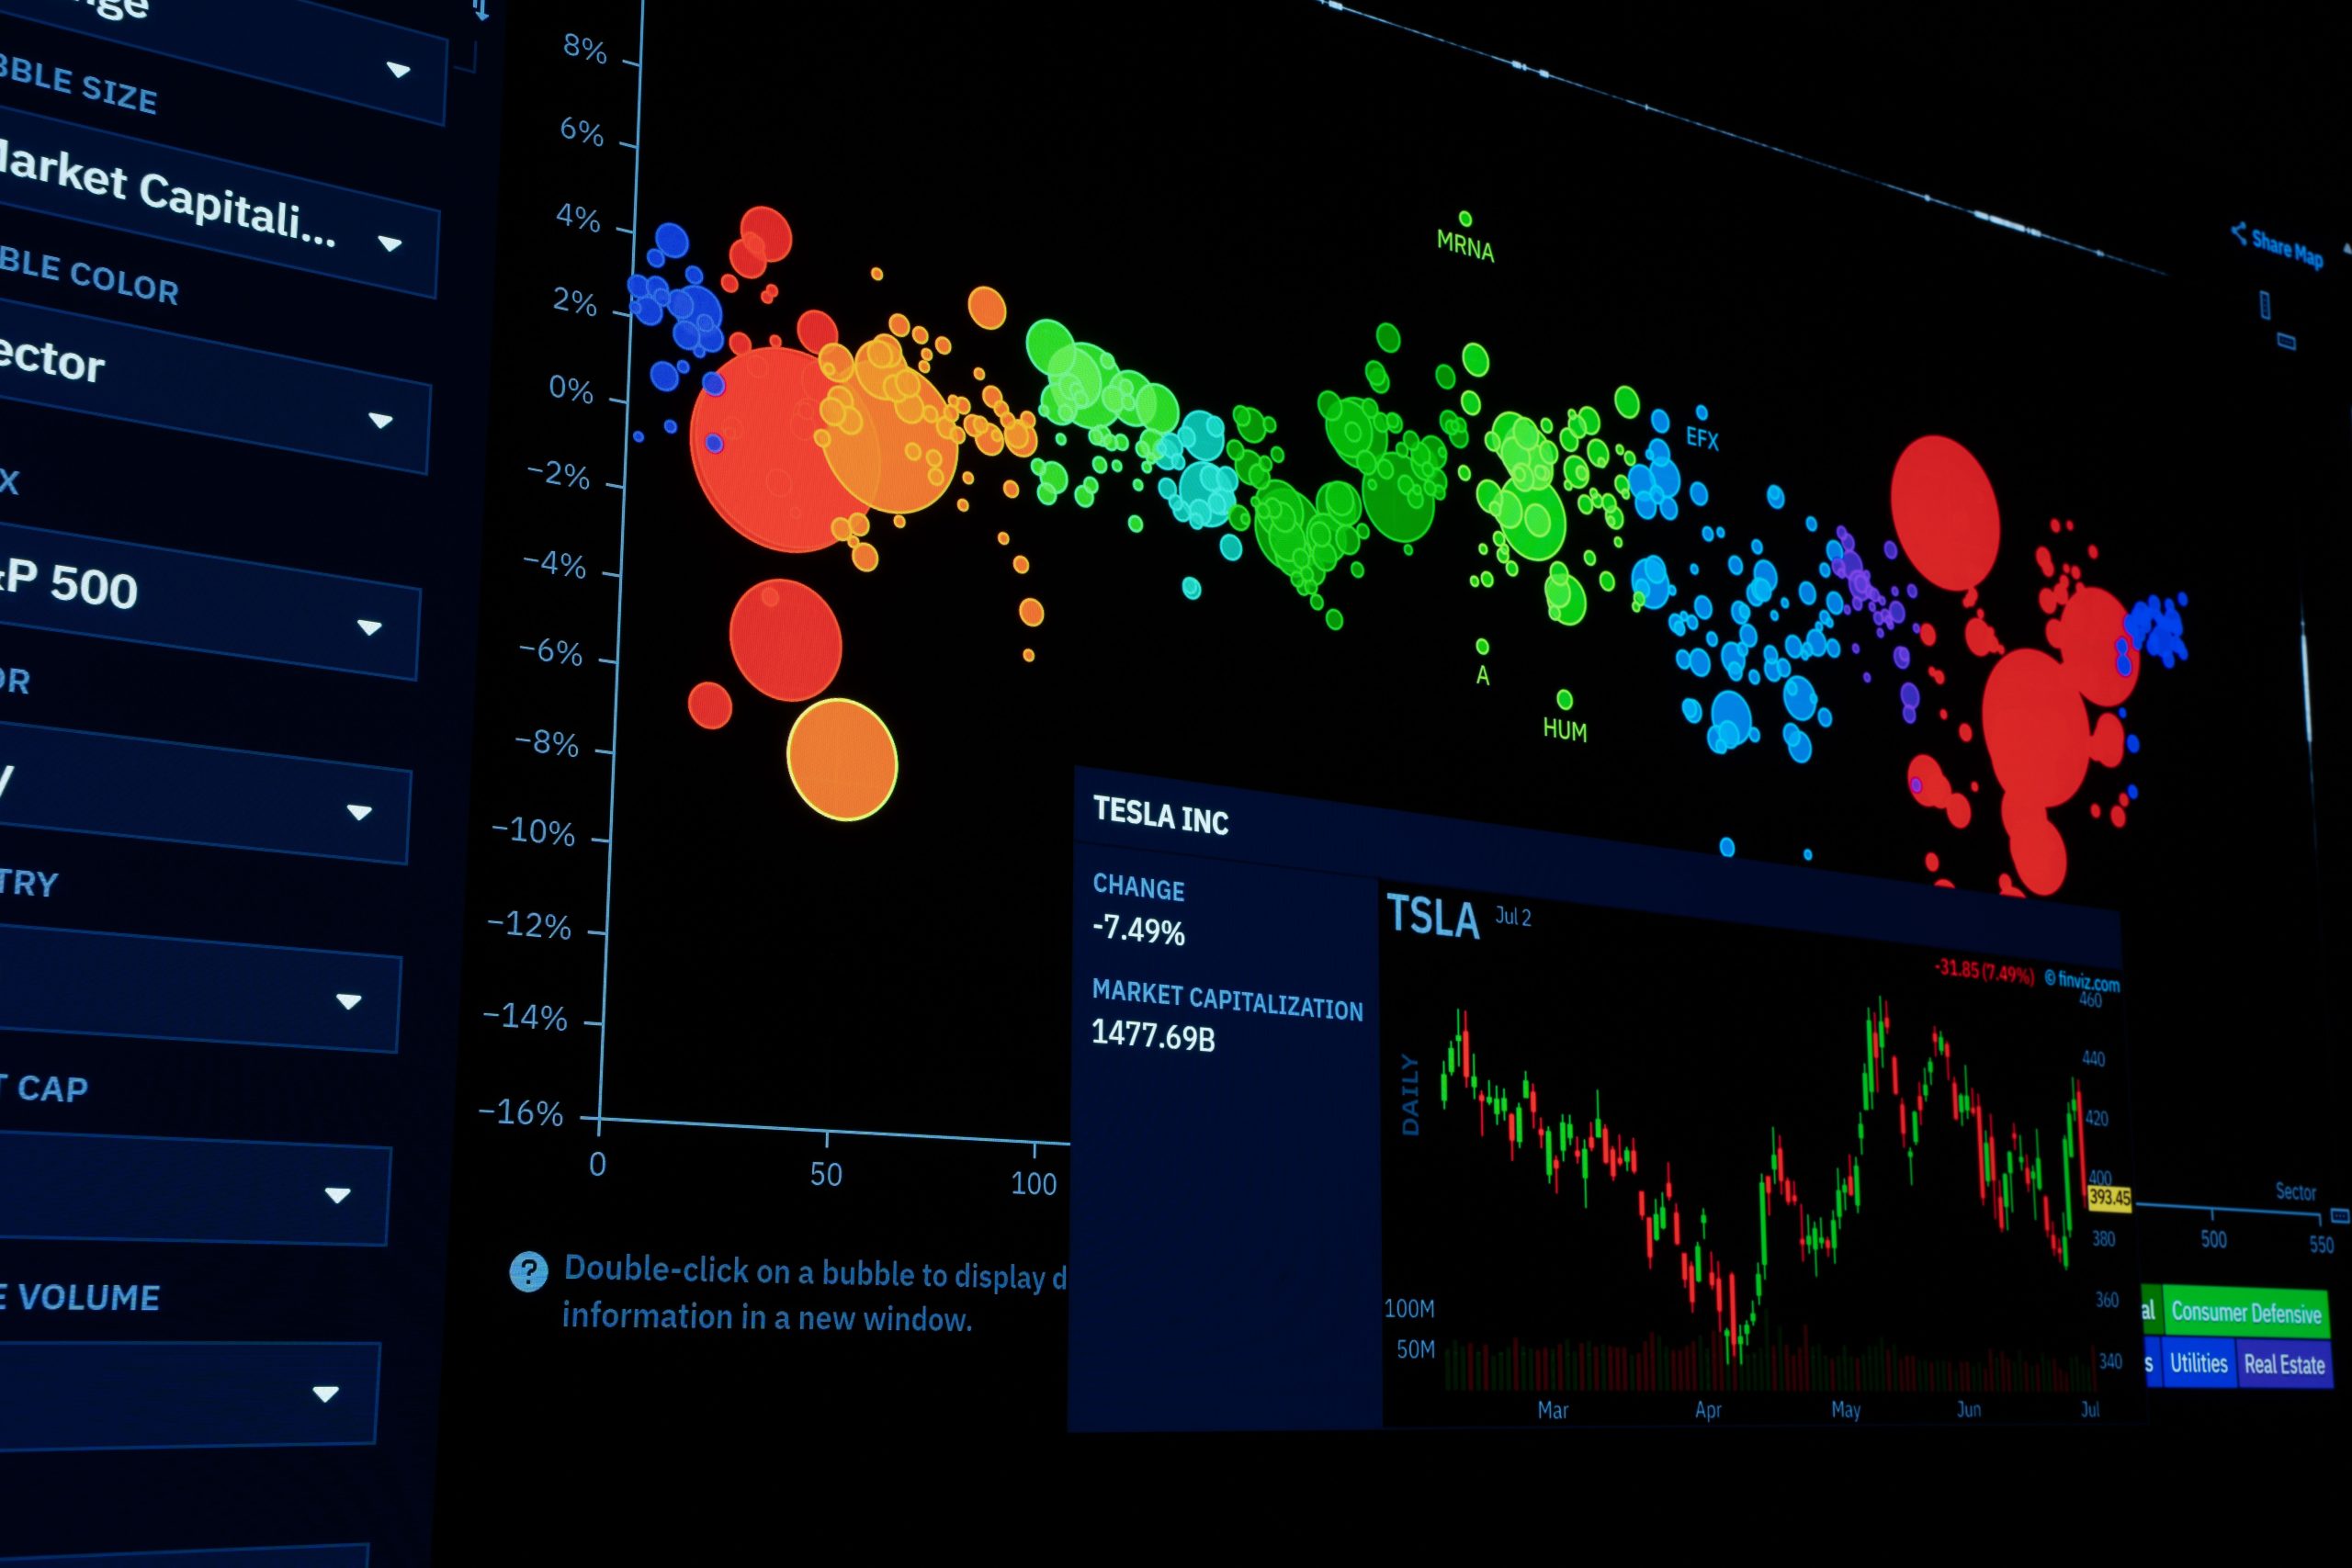
In an age where data drives decisions, effective visualization is critical, especially in environmental science. These dashboards help professionals and enthusiasts alike make sense of complex information, identify trends, and communicate findings clearly. Dive into our curated list of the best environmental science data visualization dashboards that will elevate your understanding of the planet’s health.
Whether you’re a researcher, policymaker, or just a curious individual, these tools will provide you with the insights you need. Ready to explore? Let’s get started!
1. Tableau – Best for Interactive Visualizations
Tableau is one of the leading platforms for creating stunning interactive visualizations. Its user-friendly interface allows users to easily analyze data and present it in a visually appealing manner.
Key Features:
- Drag-and-drop functionality for easy design.
- Data blending from multiple sources.
- Real-time data analysis capabilities.
Pros:
- Highly customizable dashboards.
- Strong community support and resources.
- In-depth analytics features.
Cons:
- Can be expensive for full features.
- Steeper learning curve for advanced functionalities.
2. Google Data Studio – Best for Budget-Friendly Solutions
This free tool from Google enables users to turn their data into easy-to-read informative reports and dashboards. With seamless integration to Google products, it’s perfect for eco-projects.
Key Features:
- Integration with Google Analytics, Sheets, and Ads.
- Collaboration features for team projects.
- Customizable templates for quick setup.
Pros:
- No cost involved.
- Accessible and easy to use.
- Strong sharing features.
Cons:
- Less powerful than premium options.
- Limited to Google ecosystems.
3. Carto – Best for Spatial Data Visualization
Carto excels in visualizing geographical data, making it an ideal choice for environmental analysis. Its GIS capabilities allow for sophisticated map visualizations.
Key Features:
- Rich mapping capabilities with customizable layers.
- Data-driven storytelling features.
- Integration with R and Python for advanced analytics.
Pros:
- Great for showing trends over geographic areas.
- User-friendly interface.
- Strong community and documentation.
Cons:
- Pricing can escalate for heavy usage.
- Learning curve for advanced features.
4. Microsoft Power BI – Best for Business Integration
Power BI is a robust analytics tool that transforms raw data into meaningful insights through interactive dashboards. It’s particularly useful for organizations focusing on sustainability metrics.
Key Features:
- Integration with Microsoft Excel and other apps.
- Real-time dashboard updates.
- AI-powered analytics capabilities.
Pros:
- Seamless integration with Microsoft products.
- Intuitive interface for users at all levels.
- Extensive customization options.
Cons:
- Can be overwhelming for newcomers.
- Subscription fees for advanced features.
5. GeoDash – Best for Environmental Monitoring
GeoDash specializes in environmental monitoring and reporting, ideal for agencies. It provides comprehensive insights into various environmental parameters with real-time data.
Key Features:
- Focus on environmental metrics like air quality & water resources.
- Real-time monitoring capabilities.
- User-friendly dashboards for easy navigation.
Pros:
- Tailored for environmental scientists and researchers.
- Robust reporting tools.
- Collaborative features for teams.
Cons:
- Limited integration with other platforms.
- Costly for small organizations.
6. Infogram – Best for Quick Visual Content Creation
Infogram makes data visualization accessible for individuals and organizations alike. With its straightforward interface, it’s perfect for creating infographics and social media-ready content.
Key Features:
- Drag-and-drop editor for design.
- Wide range of customizable templates.
- Interactive charts and maps.
Pros:
- User-friendly for beginners.
- Good for marketing and educational content.
- Fast content creation process.
Cons:
- Limited dataset capabilities on free tier.
- Less depth in analytics features.
7. D3.js – Best for Advanced Customization
For those with coding skills, D3.js offers unparalleled customization options for data visualizations. This JavaScript library combines data with HTML, SVG, and CSS to create dynamic visual experiences.
Key Features:
- Flexible and powerful for custom designs.
- Large library of visualizations and user-community.
- Responsive and interactive visual elements.
Pros:
- Highly customizable to fit specific needs.
- Open-source and free to use.
- Great for web developers.
Cons:
- Requires programming knowledge.
- Steep learning curve for beginners.
8. R Shiny – Best for Statistical Modeling
R Shiny is perfect for those familiar with R programming, allowing for the creation of interactive web applications. It excels in statistical analysis and environmental modeling, making complex data more accessible.
Key Features:
- Integration with R for statistical computing.
- Customizable web applications and dashboards.
- Interactive plot generation.
Pros:
- Great for statistical models and simulations.
- Highly interactive and engaging.
- Support for various data formats.
Cons:
- Requires R programming knowledge.
- Limited by R’s capabilities.
How to Choose the Right Dashboard for You
When selecting a data visualization dashboard, consider your specific needs: Are you focusing on geographical data, interactive capabilities, or budget constraints? Evaluate the learning curve and support available for each tool. Most importantly, test out the free trials where possible to find the perfect fit for your environmental science projects.
#EnvironmentalScience #DataVisualization #Dashboards #DataScience #SustainabilityTools #EcoFriendly #Analytics #VisualData